For decades, the standard playbook for measuring sales productivity has been deceptively simple: track activity. If revenue was down, the prescriptive advice was almost always to increase the inputs. More dials, more emails, more demos, more meetings.
But as we settle into a new era of B2B sales, one defined by longer cycles, larger buying committees, and tighter budgets, senior revenue leaders are finding that the correlation between raw volume and revenue is fracturing. Activity is a measure of effort, not effectiveness.
The most successful CROs and VPs of Sales in 2026 have stopped asking, "Are my reps busy?" and started asking, "Are my reps effective?"
True sales productivity metrics are not about how many hours a rep works or how many tasks they complete in Salesforce. They are about the conversion of energy into outcome. They measure the quality of decisions, the velocity of deals, and the tangible behavioral changes that lead to closed-won revenue.
When you strip away the vanity metrics, you are left with the indicators that actually predict the future of your quarter. We have analyzed the strategies of high-performing revenue organizations to identify the metrics that provide a true signal amidst the noise.
Top 15 Sales Productivity Metrics to Prioritize in 2026
These are not just KPIs; they are the diagnostic tools required to run a modern, high-efficiency revenue engine.
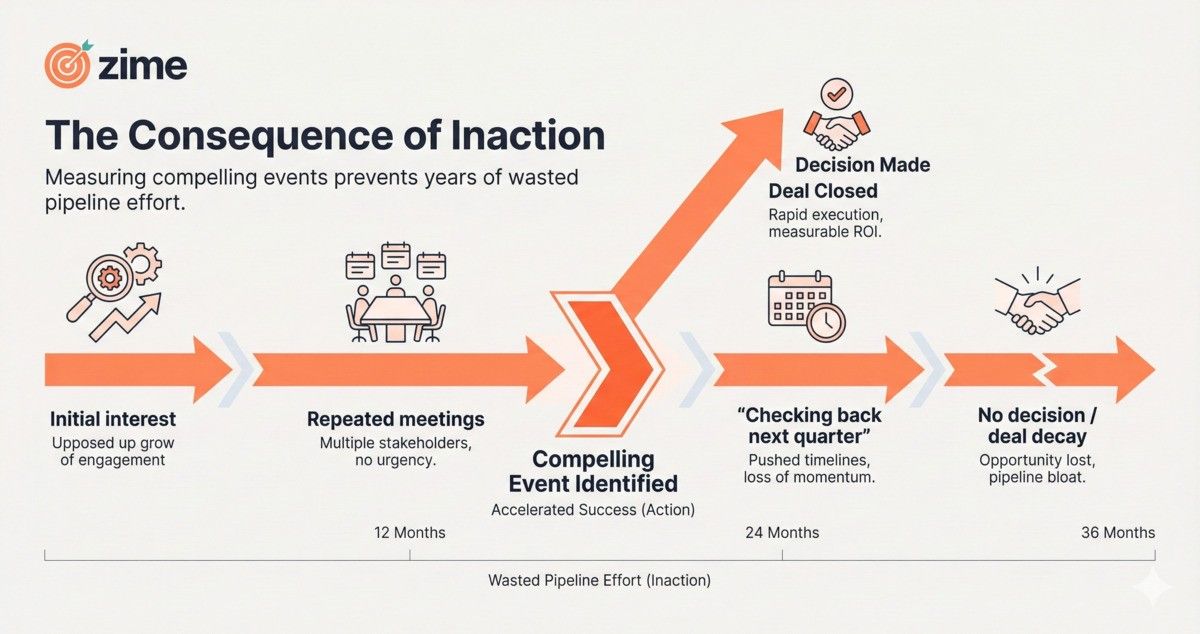
1. Compelling Event Identification Rate (The "Consequence of Inaction")
If there is one metric that separates elite enterprise sellers from the middle of the pack, it is the ability to uncover a compelling event.
In many pipeline reviews, sales leaders see deals stall not because the customer doesn’t have a problem, and not because the product isn’t a good fit. They stall because the customer lacks a compelling reason to move now. As the saying goes, "Nobody gets fired for sticking with the status quo."
Unless a rep can identify a specific “Consequence of Inaction,” such as legacy hardware burning out, a compliance fine deadline, or a massive sunk cost, the deal will likely drift into the “no decision” void.
Compelling Event Identification Rate
Why This is the Ultimate Productivity Metric
Tracking the identification of compelling events is a measure of discovery quality. It distinguishes between a "chat" and a "sales cycle."
The Problem: Most CRMs track "Budget," "Authority," and "Need," but "Need" is often interpreted loosely. A customer saying "we need to be more efficient" is a sentiment, not a compelling event.
The Productivity Unlock: When leaders measure how often reps are documenting a tangible consequence of inaction, sales cycles shorten dramatically. You stop wasting 12 to 36 months on deals that were never going to close.
How to Operationalize This
This is difficult to track via checkboxes because reps will simply tick the box to satisfy operations. This is where modern sales productivity metrics intersect with technology.
Forward-thinking organizations are now using conversation intelligence platforms like Zime to automatically analyze discovery calls. By scanning for specific language patterns that indicate a confirmed compelling event (e.g., "deadline," "risk of failure," "audit upcoming"), leaders can score pipeline health based on reality, not optimism. This allows you to identify which reps are merely having pleasant conversations and which are building a business case for change.
There is a pervasive myth in sales management that a "fat pipeline" is a healthy pipeline. This often leads to reps hoarding low-quality opportunities in the early stages to avoid scrutiny during their 1:1s.
However, a bloated early-stage pipeline is actually a productivity killer. It splits the rep's focus, diverts resources from winnable deals, and inflates the forecast.
Modern Sales Productivity Metrics that Sales Leaders Should Track
The Shift to Qualification Efficiency
Leading revenue officers are now obsessively tracking Early-Stage Win Rate. This metric looks at the percentage of deals that move from "Qualified Opportunity" to the next substantive stage (e.g., Proof of Concept or Proposal).
The Insight: If a rep has a high volume of leads but a low early-stage conversion rate, they are likely failing to disqualify bad fits early enough.
The Revenue Impact: Improving qualification doesn't just clean up the data; it directly improves win rates down the funnel. When reps are brave enough to kill bad deals in week two, they have double the time to dedicate to the deals that matter in week four.
Connecting Qualification to Revenue
The goal is to tie "better qualification" directly to revenue outcomes. It is about proving to the board and the executive team that "I improved the early-stage win rate, which is why our cost of acquisition (CAC) has dropped."
By focusing on this metric, you change the incentive structure. You stop rewarding reps for opening opportunities and start rewarding them for validating opportunities.
Metric in Action: If you move your qualification win rate from 10% to 18%, you haven't just improved a ratio; you have fundamentally altered the unit economics of your sales team.
3. Deal Velocity (Time-to-Recommendation)
Time kills deals. This is Sales 101. However, most organizations measure deal velocity broadly (Open to Close). While helpful, that is a lagging indicator.
To drive real productivity, you need to measure the micro-velocities within the sales cycle. The most critical of these is the Time-to-Recommendation.
The Bottleneck Analysis
Consider a scenario where a client has an offsite meeting next week and requests a catalog recommendation or a specific proposal.
The Lag: If the rep takes one week to get that recommendation to the client, the moment has passed. The offsite is over, the budget was allocated elsewhere, and the urgency is gone.
The Acceleration: If that recommendation happens in real-time or within 24 hours, the deal momentum is preserved.
Why Speed is a Productivity Metric
This metric exposes internal friction. It asks: "How hard is it for my reps to sell?"
If your Time-to-Recommendation is high, it usually signals:
Lack of Enablement: Reps don’t know what to recommend without asking a manager.
Process Bloat: Approvals for pricing or proposals are too slow.
Tool Failure: CPQ (Configure, Price, Quote) tools are too complex.
By measuring the gap between the "ask" and the "deliverable," you can pinpoint exactly where deals are losing oxygen. In a world of infinite options, speed of response is often the primary differentiator.
4. Behavioral Change / "Chops" Adoption
Every year, companies spend thousands of dollars per head on sales training. They roll out MEDDIC, Challenger, SPICED, or a custom internal methodology. They hold workshops, distribute playbooks, and then... they hope.
The most elusive sales productivity metric has always been: "Are they actually doing what we taught them?"
Moving Beyond "Call Completed"
Traditional metrics track whether a call happened. They do not track the quality of the call. Leaders need to know if the "value story" is being told consistently across the board.
The Blind Spot: Without a way to measure adoption, you are flying blind. You might see revenue numbers hit, but you won't know if it was due to skill or luck. If it was luck, it's not repeatable.
The Fix: You need a metric that proves behavioral change. This is often referred to as “Chops” adoption, which measures a rep’s ability to execute the specific sales motions required by the strategy.
Chops Adoption is a Important Sales Productivity Metric
Measuring the Intangible
This is another area where technology acts as the bridge between strategy and execution.
Using platforms like Zime, enablement leaders can set parameters to track the adoption of specific methodologies. For example, if you just trained the team on asking "implication questions," Zime can analyze calls to report what percentage of discovery conversations actually included those questions.
This transforms "behavior" from a subjective opinion ("I think he's doing a good job") into a hard data point ("He used the new pricing script in 82% of calls"). This is the only way to ensure that your investment in training is yielding a productivity return.
5. Stalled Deal Ratio / "Cold" Lead Analysis
There is a specific, painful type of lead that plagues every sales team: The lead that agrees to a meeting, shows initial interest, and then immediately goes cold. They don't say no; they just vanish.
The Stalled Deal Ratio measures the percentage of opportunities that enter the pipeline but stall immediately after the first or second interaction without a clear "Closed Lost" reason.
The "Dead End" Diagnostic
When a lead goes cold immediately, it is rarely a timing issue. It is usually a value articulation issue.
The Pattern: These leads represent a massive productivity leak. Marketing paid to acquire them, the SDR paid to book them, and the AE paid time to meet them. If they stall, that investment is incinerated.
The Goal: The objective is to understand why these specific leads hit a dead end. Is it a missed pain point? Was the pricing shock too high? Did the rep fail to set a next step?
Analyzing the Silence
Productivity-minded leaders treat these stalled deals as crime scenes. They investigate the "why."
This requires a deep dive into the "Cold" lead analysis. By utilizing Zime to review the final interactions before the silence began, leaders can often find the smoking gun. Perhaps the rep talked too much about features and ignored the client's stated business goal. Or perhaps the competitor was mentioned, and the rep failed to deposition them.
Identifying the root cause of the "stall" allows you to plug the hole in the bucket, ensuring that future leads don't suffer the same fate.
6. Competitive Win Rate (Win/Loss Analysis)
The Competitive Win Rate is the productivity metric that tells you where your team is strong and where they are being outmaneuvered.
Generic win rates are vanity metrics. Knowing you win 25% of your deals is interesting, but it is not actionable. Knowing you win 10% against Competitor A but 60% against Competitor B? That is strategy.
Specificity Creates Strategy
Modern sales leaders are less interested in generic loss reasons like "Price" or "Feature Gap" and more focused on "winning against specific competitors."
The Scenario: If you are consistently losing to a specific rival (e.g., a legacy incumbent or a low-cost disruptor), you need to know exactly why.
The Action: This metric informs business decisions outside of sales.
If you lose to Competitor X on price, maybe you need a "fighter brand" or a discount structure for that specific head-to-head.
If you lose to Competitor Y on security compliance, that is a feedback loop for the Product team.
From Analysis to Execution
Tracking this metric prevents the sales team from making the same mistake twice. It turns a "lost deal" into a piece of intelligence.
When a rep knows exactly who they are up against, and the leadership team has provided a specific playbook for that competitor based on win/loss data, the rep’s time is spent executing a winning strategy rather than guessing. That is the definition of productivity.
7. Funnel Conversion Ratios (Stage-to-Stage)
Managing a sales team by looking only at the final revenue number is like driving a car by looking only at the odometer. You know how far you’ve gone, but you don’t know if the engine is overheating.
Funnel Conversion Ratios (Stage-to-Stage) are the primary diagnostic tool for team performance. Instead of looking at the aggregate win rate, this metric breaks down the friction at every step of the journey.
The "Ratios" Approach
Efficient leaders manage their business units by monitoring specific ratios, such as:
Qualified Lead to Demo
Demo to Proposal
Proposal to Negotiation
Negotiation to Closure
The Early Warning System
If one of these ratios begins to "slack off," it immediately signals which part of the funnel is breaking.
Scenario A: If "Demo to Proposal" drops, you likely have a product-market fit issue or a demo skill gap.
Scenario B: If "Negotiation to Closure" drops, you might have a pricing authority issue or a new competitor undercutting you at the finish line.
By isolating the stages, you can apply surgical coaching. You don't need to retrain the whole team on everything; you just need to fix the specific leak. This saves management time and increases the impact of interventions.
8. Pipeline Review Efficiency
How long does your weekly pipeline review take? And more importantly, how much of that time is spent interrogating data versus coaching strategy?
For many leaders, pipeline reviews are an administrative burden, functioning as a forensic accounting exercise to verify whether close dates are real. This is low-value work.
Pipeline Review Efficiency measures the ability to get a high-level overview of the pipe quickly, without opening every single deal.
The 30-Minute Constraint
Imagine operating with a strict constraint: You have just 30 minutes with each rep every week.
If you spend 20 of those minutes asking, "Did you send the email?" and "Is the amount correct?", you have failed. You are doing CRM data entry by proxy.
Productivity here is defined as the speed at which a manager can absorb the state of the business.
The Goal: Managers should enter the meeting already knowing the numbers.
The Result: The 30 minutes are spent on coaching, strategizing on how to unlock a stalled deal, planning a multi-threading approach, or role-playing a negotiation.
When pipeline reviews shift from inspection to acceleration, the entire sales organization moves faster.
9. Forecast Hygiene / Pipeline Health
Forecasting is often treated as an art, but in a productive sales organization, it must be a science. Forecast Hygiene is a parallel priority to revenue itself.
The reality of modern sales is that data is scattered. Reps debate whether to communicate via Slack, Teams, email, or Chatter. Vital information is often trapped in a text message or a mental note. This leads to "scattered data" and poor visibility.
The Foundation of Trust
You cannot optimize what you cannot see. If the "activities aren't getting tracked in Salesforce," the dashboard is lying to you.
The Metric: This measures the completeness and accuracy of deal data. Are close dates constantly pushed? Do amounts fluctuate wildly? Are next steps clearly defined?
The Impact: Poor hygiene forces leadership to apply a "gut feel" buffer to the forecast, which is risky. Good hygiene allows for predictable scaling.
Simply making sure the "numbers are right" is foundational. It reduces the cognitive load on the sales leader, allowing them to focus on market strategy rather than data cleanup.
Coaching is the highest-leverage activity a sales manager can do. But you cannot coach what you cannot hear.
A major hurdle in many organizations is that sellers are not comfortable recording calls because they fear surveillance. However, without recordings, managers are forced to rely on the rep’s recollection of the call, which is notoriously unreliable.
The "Secondary Insight" Necessity
Call Recording Adoption is not just about compliance; it is about creating "secondary insight."
The Problem: A rep comes to a review and says, "The client loved the pitch."
The Reality: The client actually said, "That's interesting," which is polite code for "I'm not buying."
Without the recording (the secondary insight), the manager validates the rep's false optimism. The deal stays in the pipeline, rotting.
By measuring and enforcing adoption, leaders ensure they have the raw materials necessary to provide reality-based coaching. It makes every other metric on this list more accurate.
11. Share of Wallet / Account Expansion (Farming)
For mature sales organizations, the "Land" is just the beginning. The real profit lies in the "Expand."
Share of Wallet measures your presence within existing focus accounts. It is the antidote to the high cost of new customer acquisition.
The Flywheel Effect
In many enterprise businesses, a significant portion of revenue (often 75% or more) comes from consulting, services, or upsells. The goal is to create a "flywheel effect."
The Motion: Product customers should be cross-sold into service agreements. Service clients should be introduced to software products.
Focus Accounts
Leading organizations often designate “focus accounts,” which are typically the top 30 to 50 customers with the highest growth potential. The metric here is not just total revenue, but the breadth of revenue.
Are we in just one division, or are we the standard across the enterprise? Monitoring this ensures that farmers are not just "caretakers" of the account, but active hunters within the existing client base.
12. Champion Engagement / Events Per Champion
We all know we need a "Champion" in the account. But the binary question "Do we have a Champion?" (Yes/No) is insufficient. The better question is: "How hard is our Champion working for us?"
Champion engagement, specifically measured by “events per champion,” is a leading indicator of account health.
Measuring the "Land and Expand"
In models that rely on usage or activation (like organizing events, booking hours, or running reports), the frequency of these events directly correlates to revenue growth.
The Metric: If a single champion is booking more events or logging in more frequently, it signals entrenched value.
The Signal: A drop in champion events is an immediate churn risk alert. An increase is a signal to pitch an upsell.
This metric moves the conversation from "sentiment" (They like us) to "behavior" (They are heavily relying on us).
13. Multi-Threading Index
The most dangerous number in sales is one. One stakeholder, one champion, one contact. If that person leaves the company, your deal (and your recurring revenue) leaves with them.
The Multi-Threading Index measures the depth and breadth of your contact map within an account.
Beyond the Immediate Problem
In the context of farming and expansion, deals often start with one stakeholder solving one immediate problem.
The Growth Lever: To double the account value, the rep must connect with peers, adjacent department heads, and the C-Suite (CTOs/CIOs).
The Measurement: Are reps uncovering adjacent use cases? Are they moving laterally across the org chart?
Leaders should track the number of unique contacts engaged per opportunity. A deal with five or more engaged stakeholders across three departments has a significantly higher probability of closing and renewing than a single-threaded deal.
14. New Logo Acquisition Rate
While farming existing accounts is efficient, it has a ceiling. As some leaders note, "it is virtually impossible to find 100% of your growth every year" from existing accounts alone. Churn happens. Budgets shrink.
To layer necessary growth (e.g., 20% YoY) on top of recurring revenue, you need a healthy New Logo Acquisition Rate.
Structured vs. Organic
This metric tracks the success of "structured campaigns" to generate net new business.
The Distinction: This is not just about inbound leads falling into your lap. It is about the outbound muscle.
The Balance: If a team becomes too reliant on farming, their hunting skills atrophy. By keeping a strict KPI on net new logos, leaders ensure that the sales engine remains balanced and resilient against client churn.
15. Playbook Adherence / Process Compliance
In the early days of a startup, you rely on “hero selling,” hiring brilliant individuals who figure things out on the fly. But as you scale, particularly in SMB and mid-market segments, heroism doesn’t scale.
Playbook Adherence measures the consistency of the sales engine.
The "Percentage Filled"
For high-volume, lower-ACV deals (e.g., under $100k), you cannot rely solely on having the "best people." You need a "process or engine."
The Metric: Leaders define success not just by revenue, but by the “percentage only filled,” which reflects how well reps are adhering to the standardized playbook and consistently completing the required data points.
The Logic: If the process is followed, the results will come. If the process is ignored, success is accidental and unmanageable.
This metric is about standardizing excellence. It ensures that every customer gets the same high-quality experience, regardless of which rep picks up the phone.
Conclusion: The Shift to Insight
The transition from tracking activity to measuring productivity is a mental shift as much as an operational one. It requires sales leaders to trust that doing fewer, higher-quality things will result in better outcomes than doing many low-quality things.
These 15 metrics share a common thread: they are rooted in reality. They ignore the optimism of the sales rep and look at the behavior of the buyer and the mechanics of the process.
By monitoring Compelling Events, Deal Velocity, Behavioral Change, and Pipeline Health, you stop hoping for a good quarter and start engineering one.
In 2026, the best sales leaders won't just be the ones with the loudest cheerleading voices; they will be the ones with the sharpest diagnostic tools.
Frequently Asked Questions (FAQs)
1. What are sales productivity metrics, and why are they critical for sales leaders in 2026?
Sales productivity metrics measure how effectively sales effort converts into revenue outcomes, not just activity volume. In 2026, longer sales cycles, larger buying committees, and budget scrutiny mean leaders must track metrics tied to deal velocity, qualification quality, and behavioral execution rather than calls, emails, or meetings alone.
2. How are sales productivity metrics different from traditional sales KPIs?
Traditional sales KPIs focus on inputs and outputs, such as number of calls, pipeline size, or quota attainment. Sales productivity metrics go deeper by measuring effectiveness, including discovery quality, stage-to-stage conversion, time-to-recommendation, and deal momentum. These metrics explain why results happen, not just what happened.
3. Which sales productivity metrics are the most predictive of revenue outcomes?
The most predictive sales productivity metrics are leading indicators tied to buyer behavior and deal progression. These include Compelling Event Identification Rate, Early-Stage Win Rate, Deal Velocity, Stalled Deal Ratio, Funnel Conversion Ratios, and Competitive Win Rate. Together, they highlight whether deals are real, urgent, and winnable.
4. What tools help improve sales productivity by linking rep behavior to revenue outcomes?
Sales productivity improves when teams can directly connect rep behavior to deal outcomes. Zime enables this by tracking behavioral adoption across calls, such as qualification questions, pricing conversations, and competitive positioning, and tying those behaviors to win rates, deal velocity, and stalled deal reduction.
5. How do sales productivity metrics improve forecasting accuracy?
Sales productivity metrics improve forecast accuracy by enforcing better pipeline hygiene and data integrity. Metrics like forecast hygiene, pipeline review efficiency, and call recording adoption reduce reliance on gut feel and optimism, allowing leaders to base forecasts on verified buyer behavior and documented next steps.
6. How often should sales productivity metrics be reviewed and optimized?
Sales productivity metrics should be reviewed weekly at the rep and pipeline level, monthly at the team level, and quarterly for strategic optimization. Frequent review allows leaders to spot early warning signs, correct behavior quickly, and continuously refine sales processes as market conditions change.
Author
Atul Singh
Growth Marketer
In this Blog
Have industry-leading sales tips sent straight to your inbox.
Sign up for our newsletter to stay updated on how modern technologies are revolutionizing sales methodologies.