Why knowledge graphs aren't enough: what closes the gap between CRO strategy and rep execution?

- The knowledge graph you funded is doing its job. It connects your CRM, your calls and your deals. It answers questions about any of them, with sources. Your agents read from it. Keep it.
- But the hard part is getting this quarter's strategy run in every deal. The graph learns from deals that already happened, and your kickoff plan has none. By the time it does, reps have improvised their own version. If the number is flat, you cannot tell whether the strategy was wrong or never run.
- That is the job of a Behavior Graph, a sales execution layer. It holds your strategy as you set it and how your best reps win, with the context of past deals. It turns them into the move for this rep and this deal, before the call.
- So you keep what you bought, and you see the strategy run. Reps get the move in Slack, Teams or Claude, and each run ties back to the strategy and the deal it touched. That is 80% of eligible reps within 90 days. It is live in 7 days.
Your graph learns from deals that already happened. Your strategy has not happened yet.
The short answer: a sales execution layer that sits on top of your knowledge graph. A knowledge graph learns from deals that already happened, so a strategy set this quarter has no history for it to learn from. The missing layer starts from the CRO's plan and how the best reps win. It gives each rep the move for their deal before the call, and checks every deal against the plan that authorized it.
The stakes reach well past sales. Gartner expects over 40% of agentic AI projects to be canceled by the end of 2027. BCG found only 26% of companies had moved beyond proofs of concept to generate value.
It is Sunday night, and as CRO you are building the board deck. Slide one shows the AI spend, up again. Slide two shows what it bought: agents for every rep, and a knowledge graph that ties your CRM, calls and deals together. Slide three shows win rate. It has barely moved.
The build is not the failure. Ask the graph about any deal and it answers in seconds, with sources. Foundation Capital called context graphs AI's trillion-dollar opportunity in December 2025, and yours earns the label. If you have one, keep it. If you are adding one, add it.
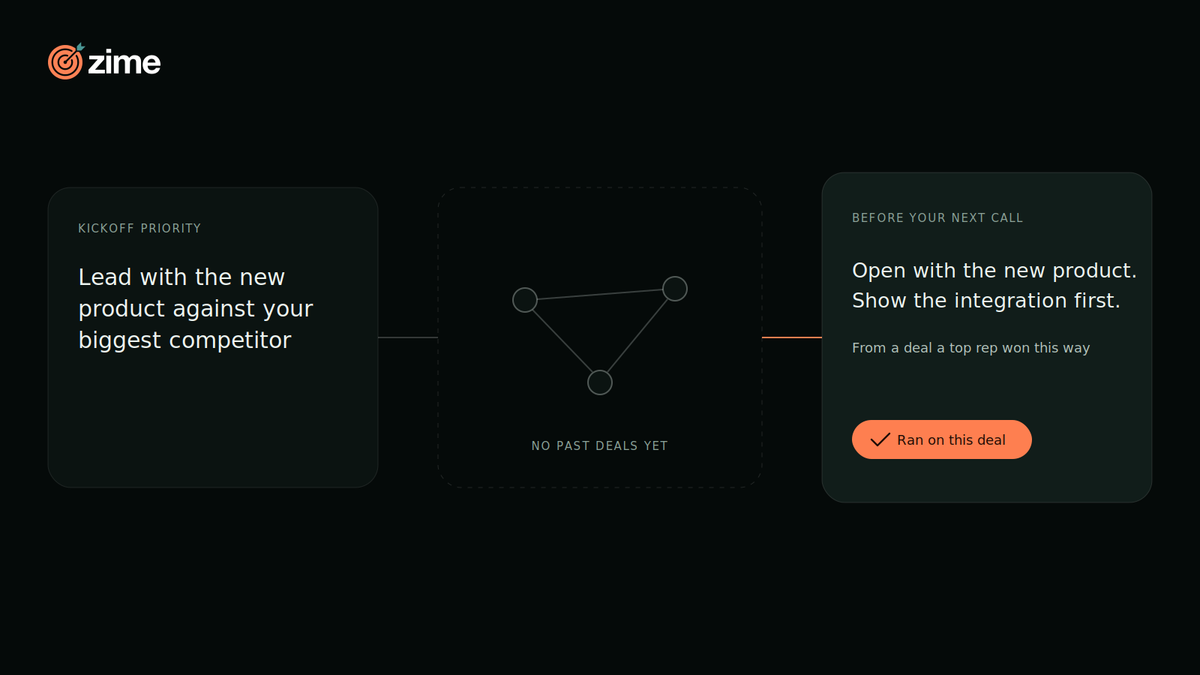
On Monday you sit in pipeline review. You ask three reps how they are running the kickoff priority: lead with the new product against your biggest competitor.
One leads with it. One saves it for the second call. One has not heard it put that way. Three reps, three versions of your plan.
The graph can tell you what each of them did. It cannot tell you who did what you meant, because nothing in it holds what you meant. So what kind of system gets this quarter's strategy run in every deal, and shows you that it did?
Why can't a knowledge graph learn a new strategy?
A knowledge graph learns from deals that already happened. A plan set at this quarter's kickoff has none behind it yet. The usual fix is more data: connect more sources, tune the agents, wait a quarter. The trouble is timing.
By the time the new motion leaves enough deals to learn from, reps have run their own versions. The graph then learns the compromise, faithfully.

You can see it in the answers. Ask the graph for the best move on a deal under the new priority, and it cites last year's deals. It is doing exactly what it was built to do. Is a context graph enough for your GTM agents? walks through the same limit from the builder's side.
Why don't enablement or recommendation tools close the gap?
Neither one starts from your plan, and neither checks each deal against it.
Another enablement round gets reps through the certification. Then the plan fades within weeks, because it lives in a deck, not in the deal. Completion is high. The calls sound the same.
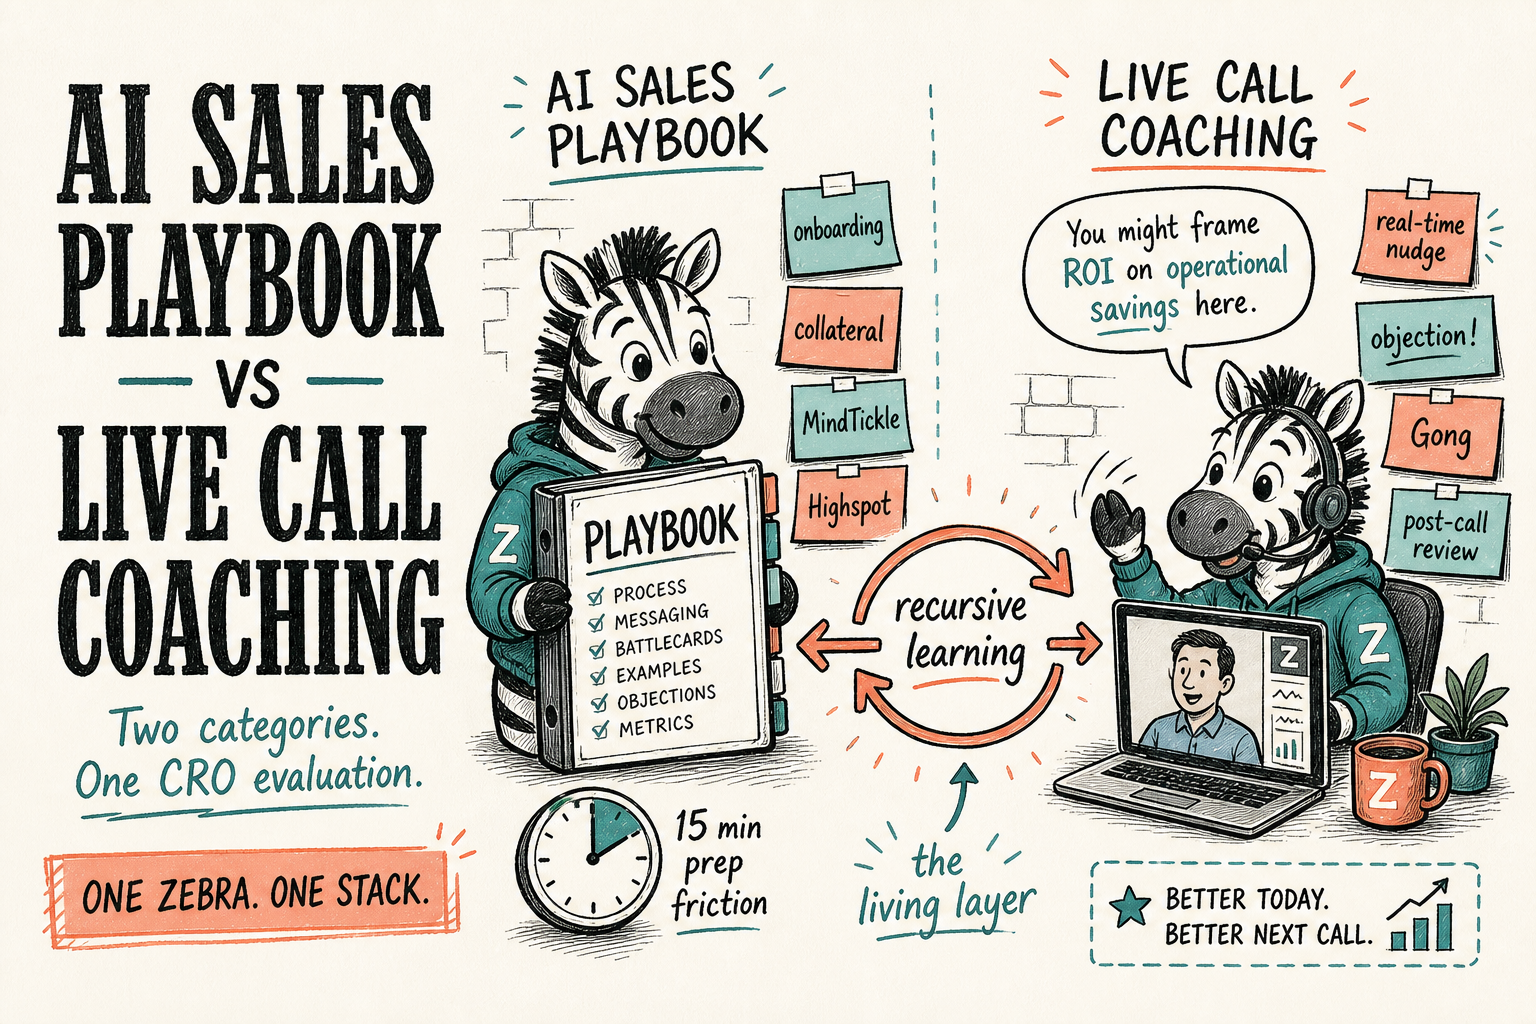
The other route is a tool that tells reps what to do. Orchestration, conversation intelligence, coaching apps and the graph itself all recommend a next step. Both kinds of system recommend. The difference is the source: patterns in past deals, or your plan and the way your best reps win.
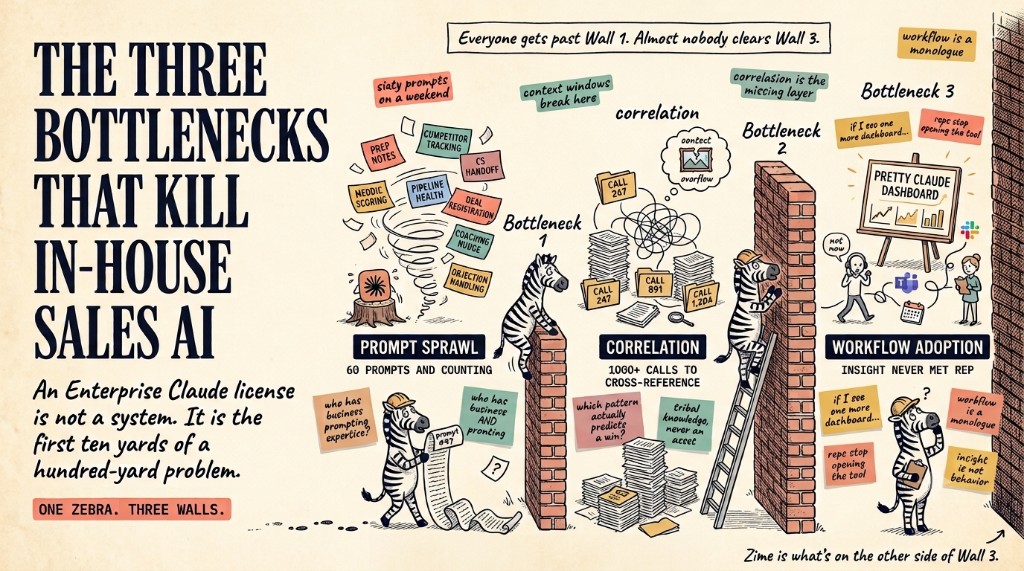
A services team can carry the plan by hand for a while, and it leaves when the engagement ends. In every case usage goes up, and you still cannot say whether the plan ran.
Chitresh Yadav runs more than a hundred SEs across four regions at Versa Networks. His in-house agents already wrote prep notes and follow-ups, and they gave him visibility rather than adoption:
"This is the dashboard I typically see, and it is drowning me. When I go to my org level, I'm drowning because it shows everything."
Chitresh Yadav, VP and Global Head of Sales Engineering, Versa Networks
Everything was visible. Nothing told him whether the plan ran. HFS Research reached the same diagnosis in July 2026: the CRO's plan does not convert into execution, so reps revert and win rates stall.
What does the missing layer have to do?
It has to start from your plan, reach each rep in their own tools, and check each deal against the plan. More history gives you none of these.
They need two things your data never held: this quarter's strategy, and how your best reps actually win. Nobody wrote the second down. Nobody writes down a reflex.
Zime calls this sales execution layer a Behavior Graph: a model of how your company wins, built from three inputs. The first is your forward-looking strategy, as you authorized it. The second is your best people's judgment, meaning how they decide what to do in a live deal.
It is elicited through FDE-run interviews and RLHF, including what never shows up in a transcript. In plain terms, Zime's forward-deployed engineers interview your best reps. Those reps then score and correct the moves until they would run them, which is reinforcement learning from human feedback. The third input is the entity context of past deals, which Zime reads from your knowledge graph or from Execution Context, its own context layer.
What comes out are Behaviors: the specific move for this rep, this deal and this competitor, the unit of revenue execution a rep can run. Each carries a receipt, the deal where a top rep won with it. When you change the priority mid-quarter, Zime's engineers encode the new one, and the moves change with it.

Why does complexity break a graph-only approach?
Every combination of product, role, region and competitor needs its own move. A graph only holds the ones your past deals happened to cover. Versa sells several product lines, hands deals from AEs to SEs, sells across four regions and faces ten named competitors. Its deals run from $100K to $3M. Almost all of them turn on a technical evaluation.
One Behavior there reads like a rule a top SE carries in their head. Here is an illustrative one.
If an SE is in a technical evaluation and the buyer names this quarter's target competitor, run the integration test case before price comes up. The deal a top SE won that way comes attached. Change the role, the region or the competitor, and the move changes. No past deal wrote that rule down.
Reps run that move for one reason. The company stands behind it. A correlation in a dashboard is a suggestion. A move the CRO authorized is the job, and a rep can defend it in front of a buyer.
Only one of these four approaches starts from a plan with no past deals and checks each deal against it. Here is how a context graph, revenue intelligence, orchestration and enablement, and a Behavior Graph compare:
- Answers questions about past deals. Context graph: yes. Revenue intelligence: yes. Orchestration and enablement: partly. Behavior Graph: yes.
- Recommends a next step. All four: yes.
- Works from a strategy with no past deals yet. Context graph: no. Revenue intelligence: no. Orchestration and enablement: partly. Behavior Graph: yes.
- Gives each role its own move inside its tools. Context graph: partly. Revenue intelligence: partly. Orchestration and enablement: yes. Behavior Graph: yes.
- Checks each deal against the authorizing strategy. Context graph: no. Revenue intelligence: no. Orchestration and enablement: partly. Behavior Graph: yes.
Answering questions and recommending a next step are where your graph already earns its keep. Checking each deal against the authorizing strategy is where the plan finally reaches the deal.
On a Tuesday, an AE opens Slack before a call where your biggest competitor is in play. The move is waiting: open with the new product, show the integration first. Under it sits the deal a top rep won that way. He runs it, and the run is tied to the kickoff plan.
How do you test any vendor for this?
Ask it to work from a plan it has never seen in your data, and to show you what ran. Run these three tests on any vendor, including the one you already have:
- The new-plan test. Ask for the best move on a live deal under this quarter's new priority. Pass: the answer works from the plan. Fail: it cites last year's deals.
- The who-ran-it test. Pick one kickoff priority and ask who ran it, on which deals, this week. Pass: a list by deal and rep. Fail: logins and completion rates.
- The change test. Change the priority and ask when the moves reps see will change. Pass: within the system, without waiting for new deals. Fail: after the next quarter of data.
Then ask one more question: will reps feel it as help before the call, or as someone watching over their shoulder?
What does day 90 look like?
By day 90 you can see who ran the plan, on which deals, and what the buyer did next. Run the same Monday review again. This time the three answers match. Each rep got the move for their role before the call. When the board asks why win rate moved, you can tell a strategy problem from a rollout problem.
Martin Mackay, Versa's CRO, described the pipeline he started with:
"Only about a quarter of our pipeline is in the late stage, and the rest of it is various degrees of fiction."
Martin Mackay, CRO, Versa Networks
He did not need more activity. He needed a number he could trust. Zime turned his priority, qualifying early-stage deals, into Behaviors for Versa's SEs. Versa reports 79% of SEs running the right technical discovery within three months, up from 20% at the start.
Versa also saw a 20% increase in SASE pipeline. HFS Research reported a 10% increase in win rates.
Brent Bair, a regional sales leader there, saw it first in his own team:
"As I look at my team, the adoption rate has improved. I think it's become ingrained in our sales DNA..."
Brent Bair, Regional Sales Leader, Versa Networks
Adoption showed up in his team before the number.
Bureau's product updates used to sit across Jira, Confluence and spreadsheets. Ranjan R Reddy, its founder and CEO, saw what changed when releases reached reps as they shipped:
"We improved our ARR by 10% with Zime seamlessly getting our product releases to our sales team in the form of just-in-time Actions."
Ranjan R Reddy, Founder & CEO, Bureau
When the plan changed, the reps changed with it.
At MyAdvice, which sells to medical, dental and legal practices, the plan already existed as a conversion checklist. Reps did not run it on every call. Once Zime checked every call against it, the rare call going wrong stopped slipping past. Chad Erickson, VP of Sales & Strategy, described the system catching one:
"Incredibly encouraging to me is that the Zime technology picked up on it… a needle in a haystack…"
Chad Erickson, VP of Sales & Strategy, MyAdvice
Fatal objections there fell from 38% of calls to 4%, an 89% reduction.
SonicWall sells cybersecurity through channel partners in more than 215 countries and territories. Reps making clear end-of-call asks rose 30 to 40%, and SonicWall grew from 40 to 85 seats, a 112.5% expansion.
When is a knowledge graph alone enough?
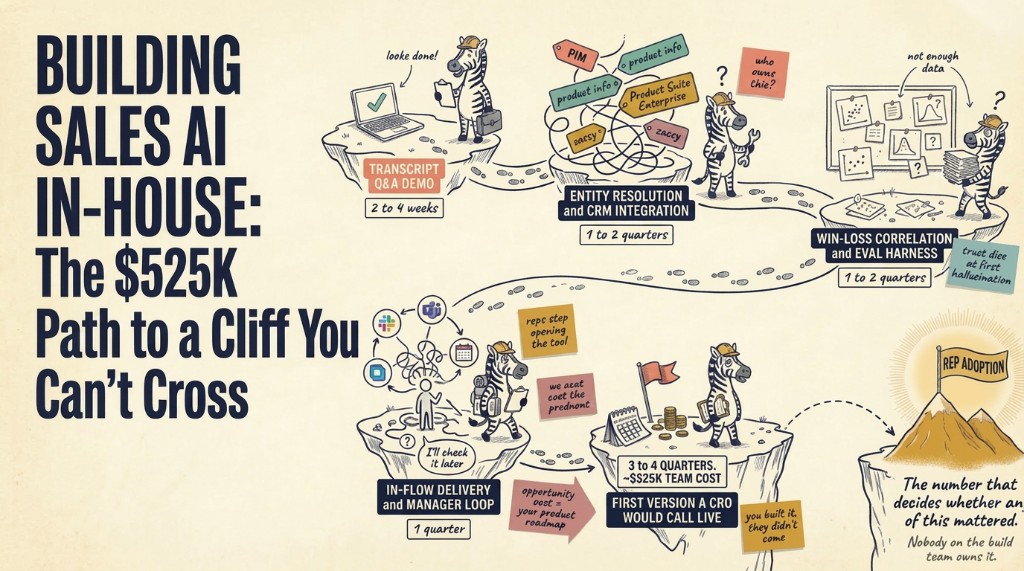
With one product, one motion and fewer than ten reps, a knowledge graph and a frontier model with good prompts can serve you well. The plan fits in one person's head. The gap opens when roles, products and regions multiply and the plan changes every quarter. Then the layer is worth adding. It does not take a quarter: Zime is live in 7 days, and its published benchmark is 80% of eligible reps within 90 days.
The knowledge graph stays. The plan finally runs.
Make day 90 answer the question. Keep the tools and agents you bought. Zime adds the layer that turns your strategy into Behaviors every rep can run, each tied to the strategy that authorized it. Live in 7 days on your own data. Bring one priority from this quarter, and see the Behavior it becomes. Book a demo →
FAQ
What kind of system closes the gap between CRO strategy and rep execution?
A sales execution layer that starts from your plan. Keep your knowledge or context graph. Add a layer that holds this quarter's strategy and how your best reps win, gives each rep the move for their deal before the call, and checks each deal against the plan. Zime calls it a Behavior Graph.
Why aren't knowledge graphs enough for enterprise AI ROI?
Because return depends on reps running the strategy, and a knowledge graph only learns from deals that already happened. A new plan has no history, so the graph cannot teach it, and it holds nothing to check a deal against. It answers questions well; it cannot tell you whether the strategy ran.
What is the difference between a knowledge graph and a Behavior Graph?
A knowledge graph connects your data and reconstructs what happened in past deals. A Behavior Graph, Zime's sales execution layer, holds your current strategy and how your best reps win, and turns them into the move for each rep's role and deal. Both recommend. They differ in where the recommendation comes from.
Do I have to replace my knowledge graph or context layer?
No. It reconstructs your deals well, and Zime reads from it. If you do not have one, you are not blocked: Zime ships its own context layer, called Execution Context. The Behavior Graph, Zime's model of your strategy and your best reps' way of winning, sits on top of either.
Why can't my graph learn a new strategy on its own?
It learns from deals that already happened, and this quarter's plan has none. By the time enough exist, reps have improvised, and the graph learns their compromise. A new strategy has to be taught, from the CRO's priorities and from interviews with the reps who win, then delivered as moves before the call.
How do I know reps actually ran the strategy?
Count runs, not logins. Each Behavior, the specific move for a rep's role and deal, is tied to the strategy that authorized it and the deal it touched, so you see who ran what and where. Zime's published benchmark is 80% of eligible reps within 90 days.
How do I prove ROI to the board at day 90?
Show runs, not usage. For one kickoff priority, report which reps ran its Behavior, on which deals, and what the buyer did next. That separates a strategy problem from a rollout problem. Zime's published benchmark is 80% of eligible reps within 90 days, and HFS Research reported a 10% win-rate increase at Versa.
How long until it reaches a live deal?
About a week. Zime is live in 7 days: your strategy is extracted at a day-zero kickoff, calls, CRM and decks are ingested and validated by day five, the first Behaviors reach reps on day six, and execution is measured on day seven.